When we think of the term “Global Warming” we often tend to think of it as a measurement of specific things. For example weather extremes such as an increase in the frequency or distribution of storms, or rising temperatures. Familiar as they all are, they are not the only metrics. There are other very specific climate boundaries that we can observe changing such as the permafrost line or the size of the Sahara desert.
These are all shifting rapidly and that alone should cause us a considerable degree of alarm. Such changes are also a very specific and direct fact-based measurement that adds to the mountains of scientific evidence.
The freelance science journalist Nicola Jones from the University of British Columbia, usually writing for New Scientist, Nature or Scientific American, has published an article in YaleEnvironment 360 that lays out the details of how the climate map on our sphere is being redrawn by us.
The full article titled “Redrawing the Map: How the World’s Climate Zones Are Shifting“, is quite frankly shocking stuff. To give you a feel for it all I’ve pulled out a few of the startling highlights below …
The Tropics are getting bigger
Change Rate: 30 miles per decade
from a climate perspective, most scientists draw the edges of the tropics instead at the nearby boundary of the Hadley cell — a large-scale circulation pattern where hot air rises at the equator, and falls back to earth, cooler and drier, somewhere around 30 degrees latitude north (the top of the Sahara desert and Mexico) and 30 degrees south (the bottom of the Kalahari Desert).
This has a huge impact …
since satellite records started in the late 1970s, the edges of the tropics have been moving at about 0.2-0.3 degrees of latitude per decade (in both the north and the south) .The change is already dramatic in some areas, Lu says — the average over 30 years is about a degree of latitude, or approximately 70 miles, but in some spots the dry expansion is larger. The result is that the boundary between where it’s getting wetter and where it’s getting drier is pushing farther north, making even countries as far north as Germany and Britain drier. Meanwhile, already dry Mediterranean countries are really feeling the change: In 2016, for example, the eastern Mediterranean region had its worst drought in 900 years.
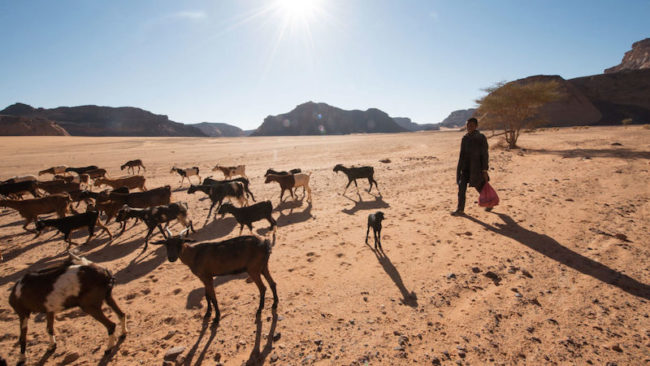
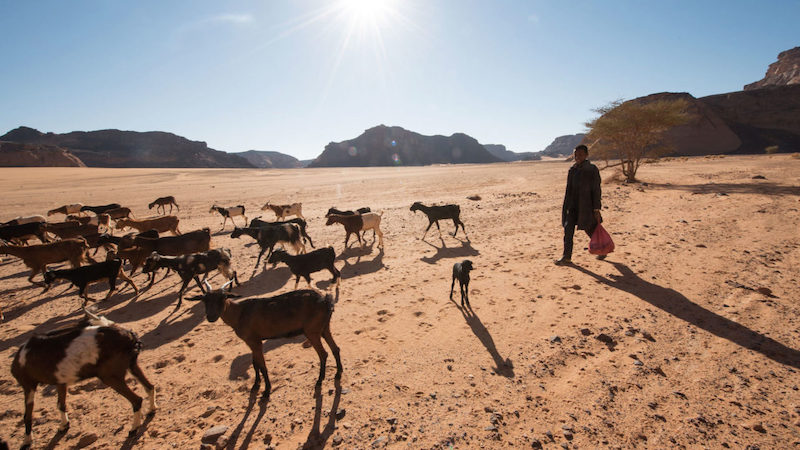
The Sahara is expanding
Perhaps related to the above, between 1920 and now it has grown by 10% …
When Natalie Thomas and Sumant Nigam, ocean and atmospheric scientists at the University of Maryland, looked at records stretching from 2013 back to 1920, they found that these boundaries for the Sahara had crept both northward and southward, making the entire region about 10 percent larger.
This has a huge impact … food production …
One study in the 1990s showed that the limit of where plants could grow in the dry southern edge of the Sahara had moved nearly 81 miles south in the 10 years between 1980 and 1990.
…Libya has gone from being mostly not desert in 1920, to mostly desert in 2013, as the line there has advanced a shocking 500 miles or so in winter months. Lake Chad, which sits on the southern edge of the Sahara, shrank dramatically from 9,600 square miles in the 1970s to less than 770 square miles in the 1990s, in part due to reduced rainfall in the Sahel, the dry region just to the south of the Sahara.
The 100th Meridian is shifting
The line between the dry US west and the wet US east has shifted 140 miles east between 1980 and now.
in March, climate scientist Richard Seager of the Lamont–Doherty Earth Observatory of Columbia University and colleagues published papers showing the transition is on the move.
The impact is also rather obvious …
agriculture will eventually have to adapt, by adding more irrigation, for example, using different seeds, or shifting their crop entirely from one plant to another.
Tornado Alley is moving
It has shifted 500 miles east in just 30 years.
Earth scientist Ernest Agee of Purdue University in Indiana and colleagues looked at tornado activity going back to the 1950s when modern tornado records began, and compared the first 30 years of records to the next 30. This showed a clear shift in where tornadoes were hitting hardest, both in terms of the total number of tornadoes and the number of tornado days. In the first half of the study period, from 1954 to 1983, an area in Oklahoma was king, with a total of 477 tornadoes. But that area’s tornado count decreased dramatically, by 45 percent, in the second half of the study period, from 1984 to 2013. Meanwhile, an equivalently sized area in northern Alabama bumped up 48 percent to 477 large tornadoes. Tennessee’s number of days of violent tornadoes doubled, from 14 to 28 days, making the state arguably the new heart of tornado activity, the authors argue.
While there is an obvious link between weather and Tornados, which leads to much speculation about what is driving this, we don’t yet truly understand why this one is happening.
Plant Hardiness Zones are moving North
The rate of change is a northwards shift of about 13 miles per decade.
The U.S. Department of Agriculture’s hardiness map, first published in 1960, is based on the average annual minimum temperature of any given spot — a metric that plays a big part in determining if perennial crops like orange trees will make it through the coldest months. Each zone marks out a 10 degrees F band, from -60 to -50 degrees F in zone 1 to 60 to 70 degrees F in zone 13. When that map was last updated, in 2012, nearly half the country was upgraded to half a zone warmer than it had been in 1990; in other words, all the lines shifted on average a little to the north. That was partly thanks to more detailed mapping techniques, the authors of the map reported, but also because temperatures were warmer in the more recent data set.
The impact …
Lauren Parker and John Abatzoglou of the University of Idaho tracked what would happen to hardiness zones from 2041 to 2070 under future global warming scenarios, and found the lines will continue to march northward at a “climate velocity” of 13.3 miles per decade. That means big changes in store for three major cash crops,
The Permafrost line is moving North
Over the last 50 years the line has moved north 80 miles.
Studies of ground temperatures in boreholes have also revealed frightening rates of change, says Schafer. “What we’re seeing is 20 meters down, it’s increasing as high as 1-2 degrees C per decade,” he says. “In the permafrost world that’s a really rapid change. Extremely rapid.”
The future looks similarly dire. One study predicts that by 2100, the area covered by permafrost might shrink from nearly 4 million square miles to less than 0.4 million; most of Alaska and the southern tip of Greenland would be permafrost-free.
The impact will be, and already is, dramatic …
In the northern Russian city of Norilsk, buildings are already tilting, cracking, and becoming condemned. In Bethel, Alaska, roads are buckling and homes collapsing. Many of the Arctic’s uncountable small lakes will also drain away. “That’s going to have a massive impact on the [region’s] ecology,” says Schafer. Meanwhile, the thaw will also release vast amounts of climate-warming methane into the atmosphere.
The Wheatbelt is moving
In Australia that line is moving at the rate of 160 miles per decade.
In the 1860s, surveyor George Goyder drew a line to show where the edge of Australia’s arable land ended. More than a century later, Goyder’s line is still considered an important feature in determining the country’s “cropping belt.” But climate change is making that land drier, effectively pushing the line further south.
Farmers are struggling to adapt …
Reductions in rainfall and warmer temperatures have already reduced the theoretical potential of southern Australia by 27 percent since 1990. So far, farmers have managed to adapt to the changing conditions and squeeze the same amount of wheat out of their lands. By tweaking things such as their seeds and harvesting practices, they have gone from harvesting 38 percent of their theoretical maximum in 1990 to 55 percent in 2015. But that can only go on so long —
It is not just Australia, this is of course also global …
North America is seeing the opposite phenomenon: Its arable land is romping northward, expanding the wheat belt into higher and higher latitudes. Scientists project it could go from about 55 degrees north today to as much as 65 degrees North — the latitude of Fairbanks, Alaska — by 2050. That’s about 160 miles per decade. That’s not all good news, as the southern edge gets drier, hotter, and less agriculturally productive. One study showed that U.S. farmers will likely have to change the strains of wheat they grow, while France and Turkey will have to invest heavily in irrigation systems. In Asia, half of the Indo-Gangetic Plains, which account for 15 percent of global wheat production, are predicted to become heat-stressed by 2050, significantly cutting yields.
The Shifting Climate
If you are truly not worried about climate change, then clearly you really do not understand what is going on.
We do understand that the root cause is human activity – doing nothing to address climate change is not an option.
Further Reading
The above is mostly quote mined snippets from the full article. Go check out the actually article itself. It includes graphics for each of the above.
