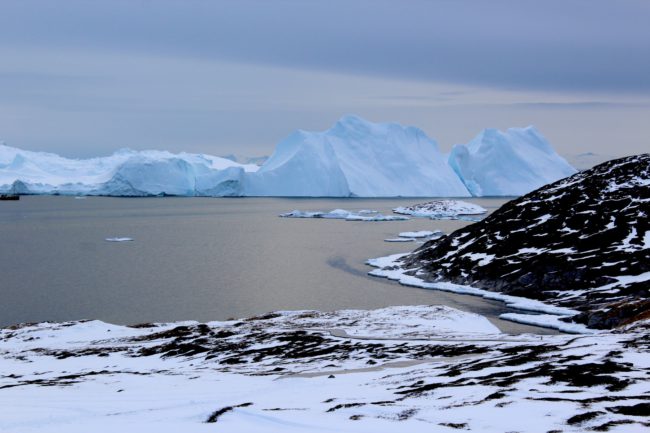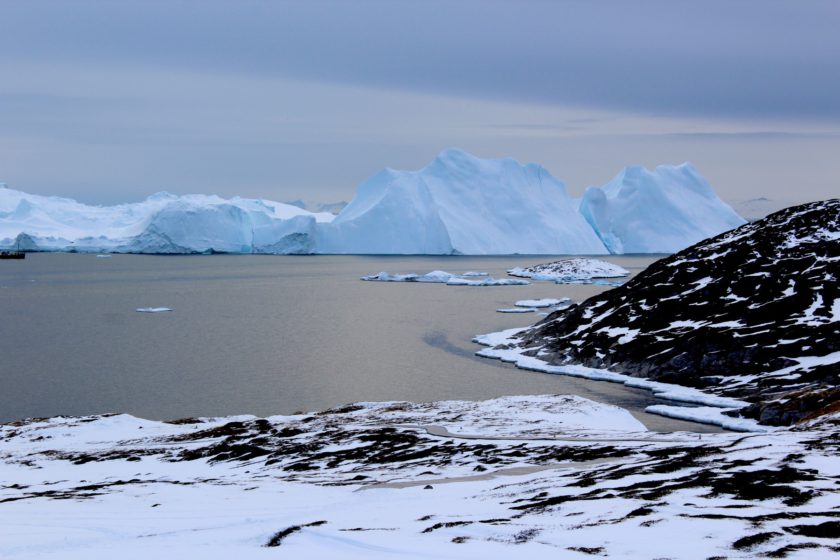
Photo courtesy of Michalea King
Evidence has been published that reveals that even if we could stop climate change on this very day, the tipping point for Greenland has already been passed. Glaciers on Greenland have shrunk so much it would continue to shrink.
Study: Dynamic ice loss from the Greenland Ice Sheet driven by sustained glacier retreat
Published on Aug 13, 2020 within Nature Communications Earth and Environment, the study uses satellite data from the past 40 years. The ice sheet is loosing mass at a greatly accelerated rate. This is currently the largest single contributor to rising sea levels.
The snowfall that replenishes the ice sheet each year cannot keep up with the ice that is flowing into the ocean from glaciers.
Widespread retreat between 2000 and 2005 resulted in a step-increase in discharge and a switch to a new dynamic state of sustained mass loss that would persist even under a decline in surface melt.
Lead Author Commentary

“We’ve been looking at these remote sensing observations to study how ice discharge and accumulation have varied,” said Michalea King, lead author of the study and a researcher at The Ohio State University’s Byrd Polar and Climate Research Center. “And what we’ve found is that the ice that’s discharging into the ocean is far surpassing the snow that’s accumulating on the surface of the ice sheet.”
King and other researchers analyzed monthly satellite data from more than 200 large glaciers draining into the ocean around Greenland. Their observations show how much ice breaks off into icebergs or melts from the glaciers into the ocean. They also show the amount of snowfall each year—the way these glaciers get replenished.
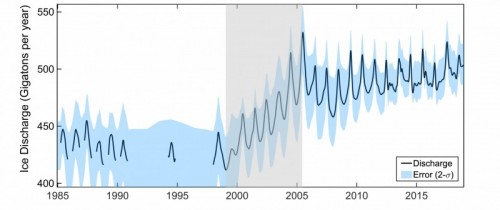
The researchers found that, throughout the 1980s and 90s, snow gained through accumulation and ice melted or calved from glaciers were mostly in balance, keeping the ice sheet intact. Through those decades, the researchers found, the ice sheets generally lost about 450 gigatons (about 450 billion tons) of ice each year from flowing outlet glaciers, which was replaced with snowfall.
“We are measuring the pulse of the ice sheet—how much ice glaciers drain at the edges of the ice sheet—which increases in the summer. And what we see is that it was relatively steady until a big increase in ice discharging to the ocean during a short five- to six-year period,” King said.
The Increase in Ice Loss
The researchers’ analysis found that the baseline of that pulse—the amount of ice being lost each year—started increasing steadily around 2000, so that the glaciers were losing about 500 gigatons each year. Snowfall did not increase at the same time, and over the last decade, the rate of ice loss from glaciers has stayed about the same—meaning the ice sheet has been losing ice more rapidly than it’s being replenished.

“Glaciers have been sensitive to seasonal melt for as long as we’ve been able to observe it, with spikes in ice discharge in the summer,” she said. “But starting in 2000, you start superimposing that seasonal melt on a higher baseline—so you’re going to get even more losses.”
Before 2000, the ice sheet would have about the same chance to gain or lose mass each year. In the current climate, the ice sheet will gain mass in only one out of every 100 years.
King said that large glaciers across Greenland have retreated about 3 kilometers on average since 1985—“that’s a lot of distance,” she said. The glaciers have shrunk back enough that many of them are sitting in deeper water, meaning more ice is in contact with water. Warm ocean water melts glacier ice, and also makes it difficult for the glaciers to grow back to their previous positions.
That means that even if humans were somehow miraculously able to stop climate change in its tracks, ice lost from glaciers draining ice to the ocean would likely still exceed ice gained from snow accumulation, and the ice sheet would continue to shrink for some time.
Co-Author Commentary

“Glacier retreat has knocked the dynamics of the whole ice sheet into a constant state of loss,” said Ian Howat, a co-author on the paper, professor of earth sciences and distinguished university scholar at Ohio State. “Even if the climate were to stay the same or even get a little colder, the ice sheet would still be losing mass.”
Shrinking glaciers in Greenland are a problem for the entire planet. The ice that melts or breaks off from Greenland’s ice sheets ends up in the Atlantic Ocean—and, eventually, all of the world’s oceans. Ice from Greenland is a leading contributor to sea level rise—last year, enough ice melted or broke off from the Greenland ice sheet to cause the oceans to rise by 2.2 millimeters in just two months.
Bleak Findings
The new findings are bleak, but King said there are silver linings.
“It’s always a positive thing to learn more about glacier environments, because we can only improve our predictions for how rapidly things will change in the future,” she said. “And that can only help us with adaptation and mitigation strategies. The more we know, the better we can prepare.”
(Posting sourced from materials provided by Ohio State University)
Data Illustrations

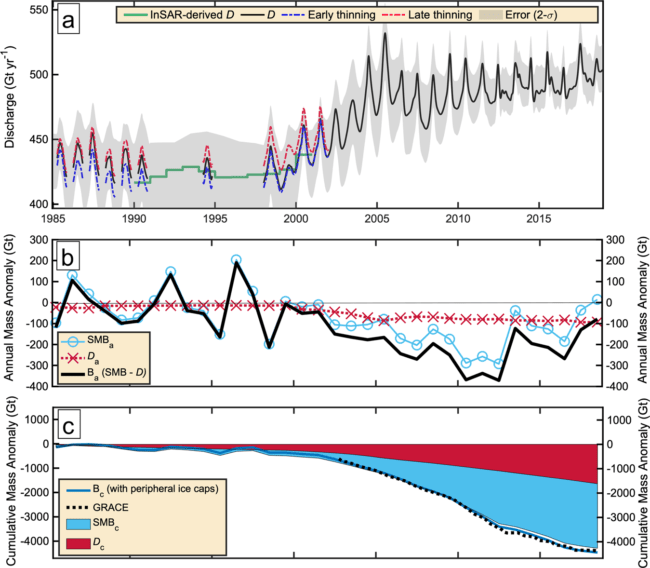
Top A: Total Greenland Ice Sheet discharge (black curve) with early (blue) and late-thinning (red dashes) scenarios between 1985 and 1999, and discharge estimates derived from wintertime InSAR (Interferometric synthetic-aperture radar) velocities from Mouginot et al. in green. Gray shading is 2-σ uncertainty.
Middle B: Net annual mass balance (Ba, black curve), annual surface mass balance (SMBa, blue dashes with circles) and total annual discharge (Da, red dashes with crosses).
Bottom C: Total shading shows the cumulative mass anomaly (Bc) of Basince 1985 broken into cumulative contributions from discharge (Dc, red) and surface mass balance (SMBc, blue). Bcincluding surface mass balance from peripheral ice caps, to match the GRACE (Gravity Recovery and Climate Experiment) domain, is plotted by dark blue line. GRACE estimates, updated from Wouters et al. for the 2002–2018 time period, are also plotted on this axis as a moving 12-month average (dotted black), and shifted along the y-axis to begin at the 2002 Bc value.
