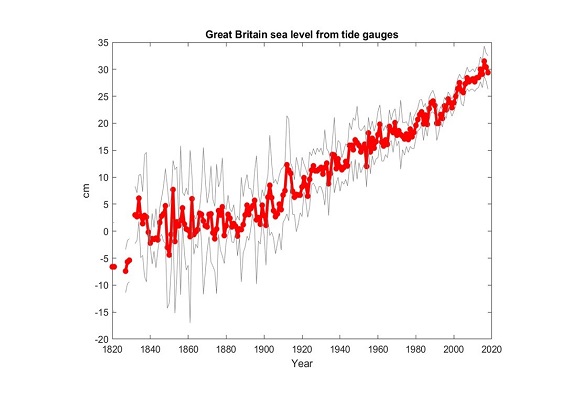
We know that sea level is rising. In fact we know the precise rate of that rise. What this study brings to the table for the first time is a very precise historical record of sea level for the UK going back over 200 years.
As you can see from the above, it was rather flat prior to 1890, then from around then started to rise.
What is new here is that the study marries historical data from many different sources with modern data to give us a continuous record going back to the 1820s.
The University of Liverpool has issued a press release that contains the detail (I’ve reproduced that further down).
Data Archaeology – Will you help?
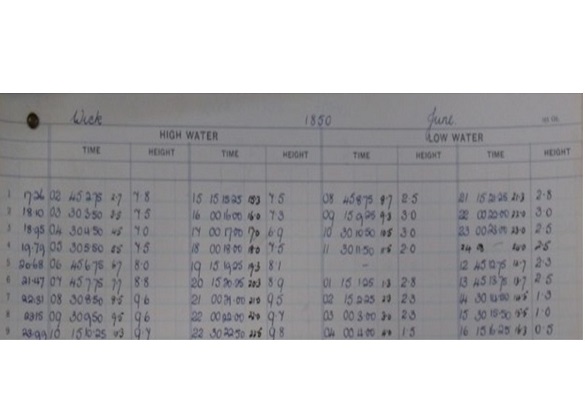
On to that press release in a moment, but first, one key point here is that collecting such data is a long tedious manual process and is still ongoing. Somebody needs to read manuscript data and compile it into a digital form.
You can help with the rescue of these data by visiting the web page: https://www.zooniverse.org/projects/psmsl/uk-tides.
The Published Paper
The paper itself is available (open access) in Science Direct – Progress In Oceanography. It was published March 2021 and is titled “Changes in mean sea level around Great Britain over the past 200 years“.
There are a couple of points to draw out here.
Firstly the obvious. It sounds simple. Collect the measurements, make a graph, job done … except it is rather obviously not that simple. You need to work out the mean sea level. You have a reading, but what time was that reading taken and so in the context of the ebb and flow of the daily tide what exactly has been measured?
Another complexity is land movement. You might indeed have data from a tidal gauge, but the land itself is rising or falling over time, so you also need to account for that.
If curious, then the paper contains a great deal of discussion on the methodology.
Highlights within the published Paper
- The paper systematically integrates a large amount of historical sea level data into a consistent and improved sea level record for Great Britain over the last 200 years.
- Much of this data is from previously unpublished sources.
- The density of new data allows an independent sea level curve to be derived which confirms the sea level rise and increase in rate of rise between the 19th and 20th Centuries observed in previous work, and in other studies from Northern Europe.
- The length of the composite record has been considerably extended, with much of the new data being from the first half of the 19th Century.
- The importance of data archaeology (and the maintenance of national archives) is demonstrated.
- A framework is provided so that any new data that is recovered in future can be added, and similar records can be constructed where data can be recovered elsewhere in the world.
What new data sources have been added into the mix here?
You might also be curious about that, so here is a list. In brief, the sources of newly assimilated sea level data (equivalent of 3348 station months) used in this paper are these:
- Continuous observations from fixed gauges at Naval Dockyards at Sheerness, Plymouth, Portsmouth and Pembroke. Annual means for several years are derived from twice daily HW and LW readings between 1832 and 1834, or for Sheerness, 1832 to 1843 and 1870 to 1894.
- Campaign data from Admiralty sources such as the Tidal Ledger, covering 168 sites from 1834 to the 1950 s; data published by the International Hydrographic Bureau (IHB; now the International Hydrographic Organization), and data included on Admiralty Charts. Time spans range from 2 week surveys using portable tide gauges to segments of over a year extracted from longer records which existed at the time.
- OS campaign data (19 sites from 1859 with spans of around two weeks, and 13 other sites with earlier dates, plus sites from 1896)
- Continuous data from “permanent” gauges published in various historical documents which has not yet been assimilated into the PSMSL records.
- Short term campaign data from civil engineering, scientific, and harbour surveys.
- 21st Century data from nine recently installed tide gauges not currently included in the PSMSL, including Blyth, Buckie, Cromarty, Inverness, Oban, Scarborough, Shoreham, Stranraer and an additional gauge at Whitby. These aid comparison with early data from these sites.
- Unpublished data and metadata recovered from the National Oceanography Centre (NOC) archives in Liverpool (PSMSL and British Oceanographic Data Centre (BODC) archives).
University Of Liverpool Press Release
Below is the press release issued by the University of Liverpool.
A study published by University of Liverpool scientists, alongside colleagues from the Liverpool branch of the National Oceanography Centre, has uncovered and analysed new sea level records from the nineteenth century which confirm that the acceleration in the rate of British sea level rise took place from 1890 onwards.
Nowadays, sea level measurements around the British Isles are made by tide gauges which record digitally and transmit the data automatically. The best of these records are fed into the Permanent Service for Mean Sea Level (PSMSL) which brings together the long, reliable tide gauge records from around the world.
However, in the nineteenth century the only long tide gauge records for Britain which stretched back beyond 1895 were from Aberdeen, Liverpool and Sheerness, and of these only Sheerness has records from before 1858.
None of these records is continuous, and it is not clear whether they represent the sea level of Britain as a whole, but they suggest that there was little in the way of British sea level rise prior to 1890.
Now in a paper published in the journal Progress in Oceanography, Liverpool researchers have for the first time produced a continuous sea level rise record for Britain dating back to 1820 by piecing together new sources of information from more than 100 new sites.
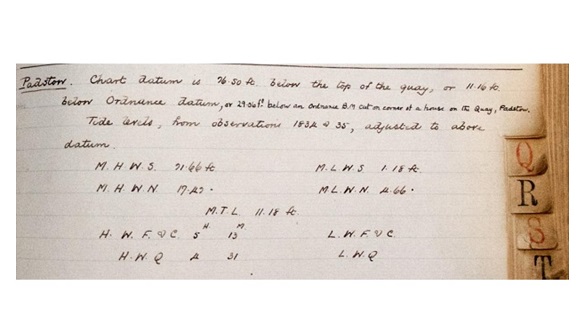
The new sources include old manuscripts, maps, admiralty dockyard data and tidal ledgers and provide a huge amount of detailed sea level data for different times and different locations around Britain.

This new information was then digitised and analysed alongside existing data records and information. This involved meticulously checking and interpreting thousands of numbers from new and existing sources to check they were correct and consistent.
University of Liverpool PhD student Peter Hogarth led the research. He said:
“Many of the new records that we have discovered are short but crucially, by finding the documented links to benchmarks and levelling between benchmarks, it has proven possible to knit them into one long record.
“This new data independently confirms the lack of sea level rise before about 1890, with a rise of about 20 cm over the 20th century, linking up to the present rate of over 3 mm/yr.”
Professor Chris Hughes, a co-author on the research, said:
This painstaking work has shown the value of “data archaeology”, in which old records are rescued and digitized, with careful interpretation to ensure the quality of the data. There are many more sources of data still to be rescued. For example, there are years of tide gauge data from Liverpool and nearby Hilbre Island, which exist only in manuscript form. Anyone can help with the rescue of these data by visiting the web page: https://www.zooniverse.org/projects/psmsl/uk-tides.”
The paper `Changes in mean sea level around Great Britain over the past 200 years’ (doi: 10.1016/j.pocean.2021.102521) is published in Progress in Oceanography.


loving this work!
Not entirely sure if this is a site interested in the scientific method but … This details the measurements from tidal gauges, its not a measuement of absolute sea level increase. Its known that the british landmass itself has a significant shift year over year — from recollection a fall in the south and a rise towards the north. This could explain the near linear nature of the data present here. The data should be converted to absolute sea level numbers before they are presented — if it is not then this is a rather poor PhD work.
The posting does tell you that they did exactly this. The paper in turn discusses this in great detail.