Not too long ago I mentioned within a posting the rather startling heatwave recorded in Antarctica. We now have images of the dramatic impact of that event via the NASA Earth Observatory. (The words below belong to their story on this, via here)
On February 6, 2020, weather stations recorded the hottest temperature on record for Antarctica. Thermometers at the Esperanza Base on the northern tip of the Antarctic Peninsula reached 18.3°C (64.9°F). That is around the same temperature as Los Angeles that day. The warm spell caused widespread melting on nearby glaciers.
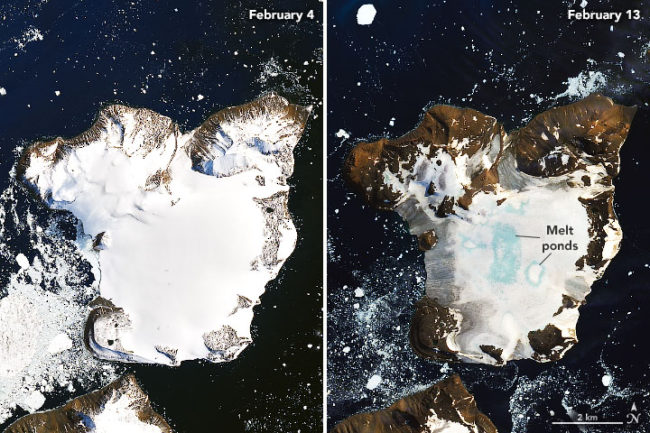
The warm temperatures arrived on February 5 and continued until February 13, 2020. The images above show melting on the ice cap of Eagle Island and were acquired via NASA’s Operational Land Imager (OLI) on Landsat 8 on February 4 and February 13, 2020.
The heatwave
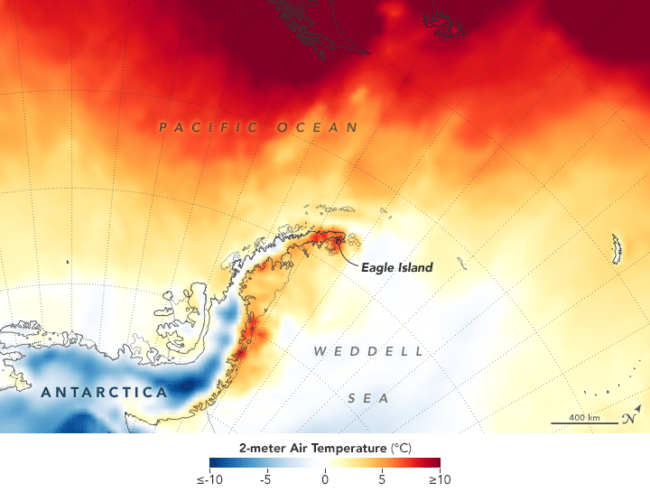
The heat is apparent on the map below, which shows temperatures across the Antarctic Peninsula on February 9, 2020. The map was derived from the Goddard Earth Observing System (GEOS) model, and represents air temperatures at 2 meters (about 6.5 feet) above the ground. The darkest red areas are where the model shows temperatures surpassing 10°C (50°F).

The Impact
Mauri Pelto, a glaciologist at Nichols College observed that during the warming event, around 1.5 square kilometers (0.9 square miles) of snowpack became saturated with meltwater (shown in blue above). According to climate models, Eagle Island experienced peak melt—30 millimeters (1 inch)—on February 6. In total, snowpack on Eagle Island melted 106 millimeters (4 inches) from February 6- February 11. About 20 percent of seasonal snow accumulation in the region melted in this one event on Eagle Island.
“I haven’t seen melt ponds develop this quickly in Antarctica,” said Pelto. “You see these kinds of melt events in Alaska and Greenland, but not usually in Antarctica.” He also used satellite images to detect widespread surface melting nearby on Boydell Glacier.
Pelto noted that such rapid melting is caused by sustained high temperatures significantly above freezing. Such persistent warmth was not typical in Antarctica until the 21st century, but it has become more common in recent years.
Why did this happen?
The warm temperatures of February 2020 were caused by a combination of meteorological elements. A ridge of high pressure was centered over Cape Horn at the beginning of the month, and it allowed warm temperatures to build. Typically, the peninsula is shielded from warm air masses by the Southern Hemisphere westerlies, a band of strong winds that circle the continent. However, the westerlies were in a weakened state, which allowed the extra-tropical warm air to cross the Southern Ocean and reach the ice sheet. Sea surface temperatures in the area were also higher than average by about 2-3°C.
Potential Role for Foehn Winds
Dry, warm foehn winds also could have played a part. Foehn winds are strong, gusty winds that cause downslope windstorms on mountains, often bringing warm air with them. In February 2020, westerly winds ran into the Antarctic Peninsula Cordillera. As such winds travel up the mountains, the air typically cools and condenses to form rain or snow clouds. As that water vapor condenses into liquid water or ice, heat is released into the surrounding air. This warm, dry air travels downslope on the other side of the mountains. This brings blasts of heat to parts of the peninsula. The drier air means fewer low-lying clouds and potentially more direct sunlight east of the mountain range.
“Two things that can make a foehn-induced melt event stronger are stronger winds and higher temperatures,” said Rajashree Tri Datta, an atmospheric researcher at NASA’s Goddard Space Flight Center. With warmer air in the surrounding atmosphere and ocean, the conditions were conducive this month for a foehn wind event.
Antarctica Heatwave Frequency Increasing
This February heatwave was the third major melt event of the 2019-2020 summer, following warm spells in November 2019 and January 2020.
“If you think about this one event in February, it isn’t that significant,” said Pelto. “It’s more significant that these events are coming more frequently.“
Story and Image Credits:
The above details came via a NASA Earth Observatory Press Release (found here and created by Kasha Patel on 21 Feb 2020). This is the alpha source for all of the media stories. NASA Earth Observatory images by Joshua Stevens, using Landsat data from the U.S. Geological Survey and GEOS-5 data from the Global Modeling and Assimilation Office at NASA GSFC.
Further Reading
- AGU Blogosphere: From a Glacier’s Perspective (2020, February 19) Boydell Glacier Accumulation Zone Rapid Melt Feature Development February 2020.
- AGU Blogosphere: From a Glacier’s Perspective (2020, February 17) Record Antarctic Temperatures in Feb. 2020 Impact on Eagle Island Ice Cap.Accessed February 20, 2020.
- National Geographic (2020, February 18) The Antarctic Peninsula is setting heat records. They won’t stand long. Accessed February 20, 2020.
- The New York Times (2020, February 8) Antarctica Sets Record High Temperature: 64.9 Degrees. Accessed February 20, 2020.
- World Meteorological Organization (2020, February 14) New record for Antarctic continent reported. Accessed February 20, 2020.
- Washington Post (24th Feb 2020) – Antarctic heat wave melted 20 percent of an island’s snow cover in days, caused melt ponds to proliferate
