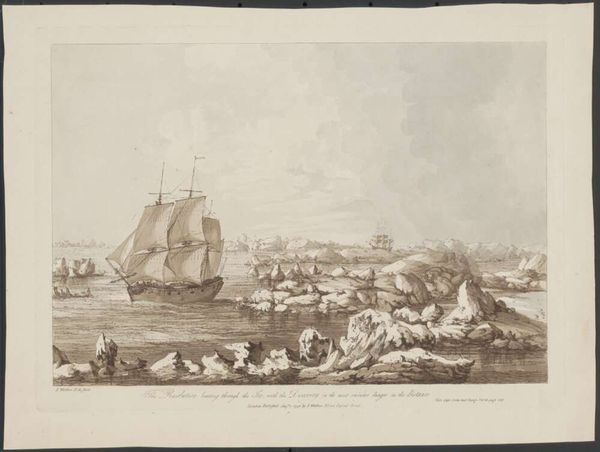
During the summer of 1778 the famous explorer and cartographer Captain Cook was well into his third voyage of discovery. When he set sail in 1776 the public had been advised that it was to return the Pacific Islander, Omai to Tahiti, but the real motive was was to locate a Northwest Passage around the American continent. After dropping off Omai, the expedition headed north and became the first European expedition to formally contact the Hawaiian Islands. Cook actually named them the “Sandwich Islands” after the fourth Earl of Sandwich who was at that time the First Lord of the Admiralty, and is perhaps better known today as the chap who apparently invented the sandwich. (I’m not kidding about that. Apparently he liked playing cards so much that he did not stop to eat, but instead ordered some meat tucked between two pieces of bread. His friends then asked for “the same as Sandwich!” and so the term was born).
After departing the “Sandwich Islands” Cook sailed North until reaching the Oregon coast and then up to Vancouver bay by about March 1778. In April he then proceeded to head North charting the North west coast all the way to the Bering Strait.
By the summer he was through the Bering Strait and heading north into the Chukchi Sea but encountered a wall of thick ice. The furthest North he got was 70 degrees 44 minutes. By September he had given up and was heading south back towards the “Sandwich Islands” and his fatal encounter there.
There was a second attempt by the same expedition the following year in July 1779, now under the command of Charles Clarke after the death of Cook, but once again they encountered and charted a wall of thick sea ice.
Cook personally never returned back to London, but the expedition’s maps and logs did, and it is that precise record of both attempts in 1778 and 1779 that have now been examined to give us a very early insight into the precise extent of Arctic sea ice.
New paper
The Journal Polar Geography has just published a new paper entitled …
Polar maps: Captain Cook and the earliest historical charts of the ice edge in the Chukchi Sea
The Introduction explains it all …
On 11 August 1778, Captain James Cook, the pre-eminent explorer of his age, sailed north through Bering Strait with two ships, Resolution and Discovery, in search of the Northwest Passage. Working his way along the coast of Alaska, his progress was halted a week later by ‘ice which was as compact as a Wall and seemed to be ten or twelve feet high at least’. This marked Cook’s farthest north, at 70°44′N, about 30 km north of Icy Cape. Turning south- west and then west, Cook sailed close to the ice edge for the next 11 days, trying to find an opening to the north. On 29 August, having reached the coast of Siberia at 69°N without finding a break in the ice, he abandoned the search, since ‘so little was the prospect of succeeding’, but he resolved ‘to return to the North in further search of a Passage the ensuing summer’. He sailed south through Bering Strait on 2 September.
Tragically, Cook was killed in Hawaii in February 1779. Command of the expedition passed to Charles Clerke, who faithfully returned to the Arctic in summer 1779 to continue the search for the Northwest Passage. The ships sailed north through Bering Strait on 6 July, more than a month earlier than the previous year. From 13 to 23 July they traced the ice edge at latitudes 69–70°N, first eastward to the coast of Alaska, then westward part way to Siberia, reaching a farthest north of 70°33′N, just 11 miles south of the previous year and yet a month earlier in the season. But on 21 July Clerke wrote, ‘this Sea is now so Choak’d with Ice that a passage I fear is totally out of the question’.
Previously we have had records of the precise extent of sea ice from ships logs going back as far as the 1850s, but this new paper pushes that back even further to 1778.
What do we now know?
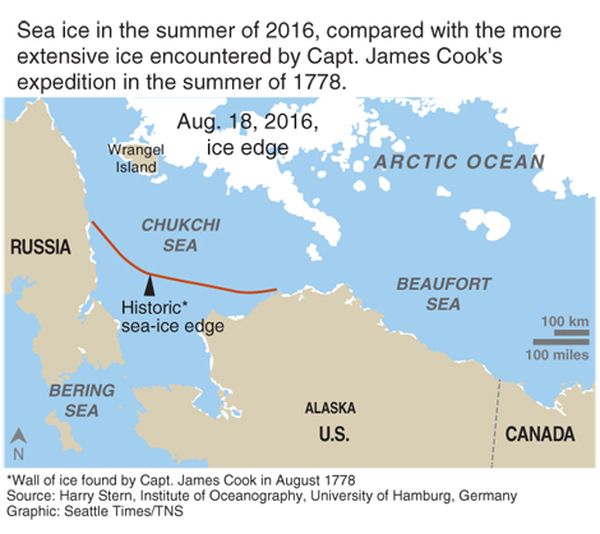
From about 1778 until the 1990s the Arctic sea ice generally extended south to roughly where Cook encountered it. It has naturally fluctuated over the decades, but has more or less retained that same extent.
From the 1990s onwards that all began to change dramatically.
We have observed a dramatic shrinkage of Arctic sea ice when compared to what was measured in the 1980s. Now looking back on far older records and using these very early but accurate maps and ships logs, we are able to see just how dramatically different the past three decades have been.
There were others, so why Cook?
Older maps exist. Cook himself arrived, not with a blank piece of paper, but instead had two maps of the region based on earlier Russian explorations: one by Gerhard Müller from 1754, as re-printed by Thomas Jeffreys in 1761; and one by Jacob von Staehlin from 1773. Staehlin’s map shows Alaska as an island, which greatly frustrated Cook who wrote …
what could induce him to publish so erroneous a Map? in which many of these islands are jumbled in regular confusion, without the least regard to truth and yet he is pleased to call it a very accurate little Map? A Map that the most illiterate of his illiterate Sea-faring men would have been ashamed to put his name to
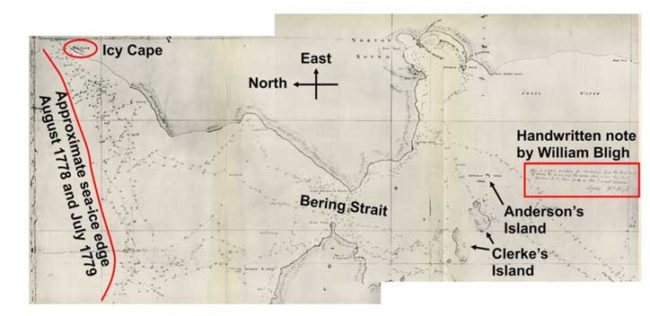
What makes Cook’s maps and logs special is the precise accuracy of them and also his charting of the extent of the sea ice. Here below is his chart showing it. The little black dots are the precise measurements of the ships location when a reading was taken. The image of the chart below comes from the published paper, and rather obviously the bold black and red lettering was added by them.
Of specific interest to us now is that note to the right. It was indeed “the” Willian Bligh. He is perhaps far better known as the captain of HMS Bounty when in 1789 Fletcher Christian and some of the crew mutinied and put him adrift in the longboat. Bligh then managed to sail it an almost impossible 3,618-nautical-miles to safety.
Bligh was part of Cook’s third expedition. Cook himself had chosen him to be the master of HMS Resolution. The fact that he wrote the note on the official chart later reflects his temperament, it reads …
Here is a gross mistake for Anderson’s Id & the East end
of Clerk’s Id is one and the same land & how they have
blundered to lay them down as two I cannot conceive Signed Wm Bligh
The fact that he felt compelled to write the 1778 equivalent of “FFS, this bit is wrong” on an official chart perhaps tells us a bit about his personality.
Perhaps the above map is a tad confusing because the orientation is not the one you are used to. That’s “North” on the left side and “South” on the right hand side. Below is a more modern representation that rotates it clockwise by 90 degrees. It also shows you where they encountered ice, and where the ice is now …
In the end Cook’s expedition failed. It was not because of faulty cartography, but instead was due to a barrier of pack ice. In the middle of the summer of 1778 and 1779 there was no North West passage, just a wall of thick impassable ice.
The paper finishes as follows …
Several published maps of Cook’s discoveries in the Pacific show an ice barrier north of Bering Strait, with annotation such as ‘Here the Ice’15 or ‘Here they were Stopped by Ice’,16 reflecting the information found in charts such as Figure 1. Cook was the first to actually probe and chart the ice edge north of Bering Strait, which he did with characteristic accu- racy. Nicandri (2015) fittingly concludes his essay on A New Look at Cook with these words:
“In the twenty-first century, an age whose hallmark will be massive climate change, perhaps it is time to acknowledge that the environmental backdrop for evaluating the relevance of Cook’s discoveries is certainly not a sandy beach, nor even the ocean blue, but a cool summer along that Alaska coastline leading to the Arctic ice pack.”
Summary
What we learn from this is that sea-ice conditions in the Canadian Archipelago back in 1778 were remarkably similar to those during 1971–2000. The Little Ice Age, which brought slightly colder temperatures to Europe and eastern North America between about 1450 and 1850, apparently did not have a big effect on the Canadian Arctic during the nineteenth century.
By looking back over old records we gain further evidence that what is now happening in the Arctic is unprecedented. What we are now measuring with each passing season is distinctly unique and also alarming.

