Now that the annual melt season is over, how did 2018 pan out in the Arctic?
We have very precise Satellite measurements that go back over almost 40 years so this degree of precision gives us some quite specific trends. If you are familiar with the ongoing climate change trend in the Arctic then you can probably guess where 2018 stands.
NSIDC reports …
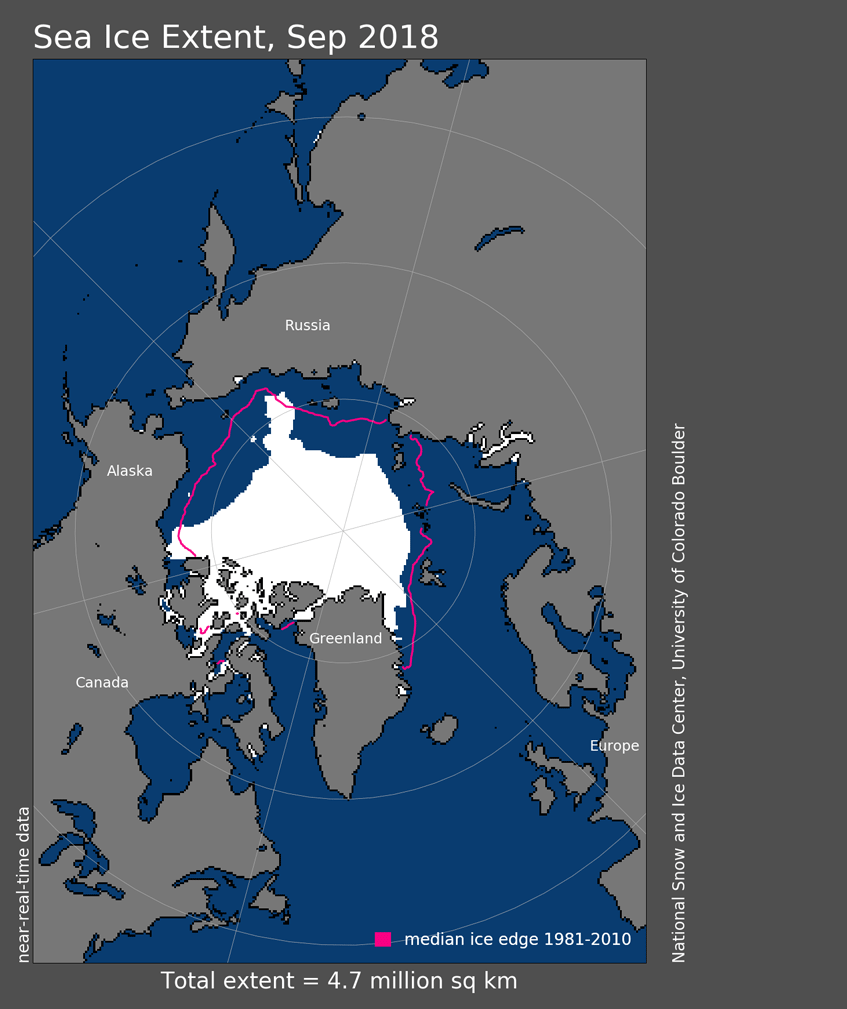
After starting the year with record lows in January and February, Arctic sea ice extent ended tied with 2008 for the sixth lowest average September extent in the satellite record. The 2018 minimum extent was reached on both September 19 and 23. September 23 is among the latest dates for the seasonal minimum in the nearly 40-year satellite record. In the Antarctic, the annual maximum extent appears to have been reached on October 2.
The specific numbers that they have are as follows:
Arctic sea ice extent for September 2018 averaged 4.71 million square kilometers (1.82 million square miles), tying with 2008 for the sixth lowest September in the 1979 to 2018 satellite record. This was 1.70 million square kilometers (656,000 square miles) below the 1981 to 2010 average, and 1.14 million square kilometers (440,000 square miles) above the record low recorded for September 2012. Prior to September 19, sea ice extent declined at a relatively rapid 14,440 square kilometers (5,580 square miles) per day, significantly faster than in most years. The near-zero loss rate between September 19 and 23, and the very late onset of significant seasonal ice growth after September 23, were atypical of the satellite record.
Numbers are a bit hard to wrap your head around, so here is a visual illustration. Below the pink line illustrates the average minimum extent of sea ice over the 30 year period (1981-2010), and that is rather obviously a huge contrast to where things now stand in 2018.
But The Sea Ice Extent Expanded
2018 is not the lowest ever, so it is clearly growing and not shrinking … right?
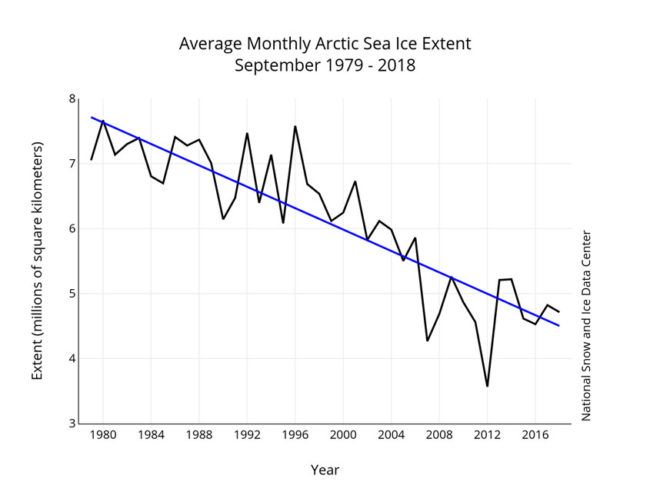
Well …. it’s not that simple. The overall trend is not a linear straight line. Weather can and does cause quite natural variations. If you compare every September over the entire satellite record, then what you discover is that there is an on-going trend …
There is a very obvious trend line going down. Most years are either above or below that, but in general adhere to the 12.8 percent per decade decline. Yes, 2018 was above the record low in 2012, but 2018 is not a story of recovery, instead it is just another data point on the ongoing decline.
Other Indicators – How Old is the Ice?
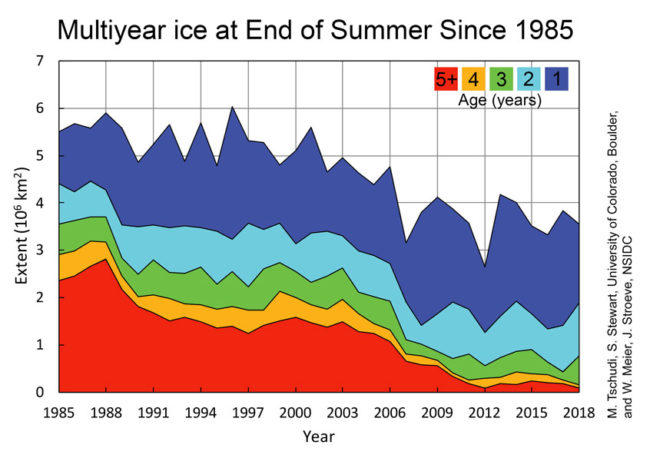
One of the other ways of looking at sea ice in the Arctic is to determine how old it is. During the summer season some ice melts and some persists. This cycle results in ice that survives over multiple seasons.
The rather loud alarm that is shouting at us is that the amount of multi-year ice is sharply declining …
Overall, the amount of multiyear ice remaining at the end of summer is considerably lower than it used to be during the 1980s and 1990s. Now multiyear ice covers 2 million square kilometers (772,000 square miles) or less of the Arctic Ocean. The oldest ice, which has survived at least four melt seasons, used to cover nearly 1.5 million square kilometers (579,000 square miles). In 2018, this old ice covered only 94,000 square kilometers (36,0000 square miles) at the September minimum.
It is not Just the Arctic
Over on the other pole the Antarctic is in the grip of Winter, so how did that pan out?
In 2018, the Southern Ocean has been true to form. Overall, September sea ice extent has been at near-record lows over the period of satellite observations. A peak in ice extent early in September was followed by a steep decline through mid-month. By the third week of September, extent increased steadily. After a few days of minimal decline, extent reached its maximum on October 2.
Pole to pole the on going trend continues.
Tweets
#Arctic #climate craziness continues: one of these things is not like the others pic.twitter.com/k8e2gIanpC
— Lars Kaleschke (@seaice_de) October 7, 2018
Still no growth in sea ice extent over the main basin of the #Arctic Ocean… pic.twitter.com/kBPfl4125p
— Zack Labe (@ZLabe) October 7, 2018
The Trajectory Towards a Seasonally Ice-Free Arctic Ocean | SpringerLink @ArcticDavos @ES_UCL @NSIDC_ArcticIce https://t.co/K9yQYhEH2O
— julienne stroeve (@JulienneStroeve) September 29, 2018
The Arctic used to be home to over 2 million square kilometers of old, hard sea ice that had endured more than 5 years. Today, the area covered by the oldest sea ice is less than 10% of what it used to be. pic.twitter.com/eGSQ7gsvNI
— Robert Rohde (@RARohde) October 9, 2018
https://twitter.com/NSIDC/status/1049397804274147328


