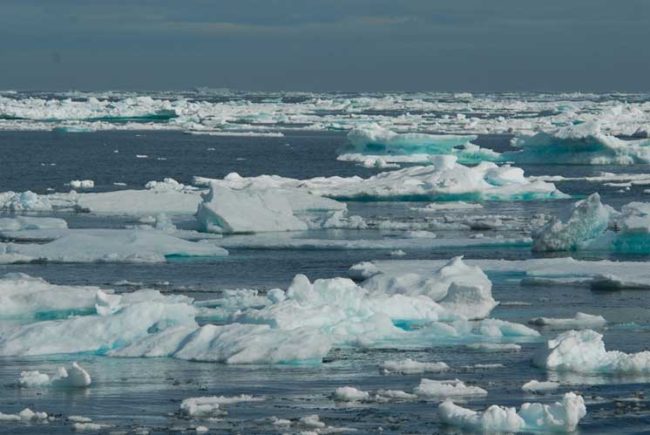
 I reported earlier, a few weeks ago, that #Arctic sea ice was in a rather dire condition and that something crazy was going on because in the middle of winter it was melting.
So where do things now stand, has it all turned out to be a blip and things are now back to normal, or has the rather extraordinary trend continued?
I wish I was wrong and that it had all reverted back to normal, but alas no, the extraordinary is indeed still the new normal.
Tweets
Zack Labe, a PhD student with a keen interest in the topic. He has been tweeting out a series of tweets that use graphics to illustrate just how uniquely extraordinary things have now become …
A remarkable retreat of #seaice (now open water) in the Chukchi Sea this past week.
(Animation by A-Team at https://t.co/Z49LsuGKQ3) pic.twitter.com/mnHb2xjNAe
— Zack Labe (@ZLabe) December 10, 2016
Areas of #Arctic Ocean 18+ C above normal again, this time north of far eastern Siberia. Warm Arctic Ocean : Cold Continents. pic.twitter.com/Zx3qhd5H4A
— Jason Box (@climate_ice) December 9, 2016
Changing November #Arctic sea ice thickness over the satellite era (from 1979, PIOMAS). Bar graph indicates total sea ice volume. pic.twitter.com/Uvbp0BnQV3
— Zack Labe (@ZLabe) December 8, 2016
https://twitter.com/ZLabe/status/806940061673484288
November was a particularly unusual month in the #Arctic –> record high temps (anomalous weather pattern), record low sea ice extent/volume pic.twitter.com/dTEuuhFvzI
— Zack Labe (@ZLabe) December 7, 2016
NSIDC has issued their latest Arctic update
NSIDC issues regular updates on conditions in the Arctic. They have issued their latest, (dated 8th Dec) and it is exactly what you might expect …
In November 2016, Arctic sea ice extent averaged 9.08 million square kilometers (3.51 million square miles), the lowest November in the satellite record. This is 800,000 square kilometers (309,000 square miles) below November 2006, the previous lowest November, and 1.95 million square kilometers (753,000 square miles) below the 1981 to 2010 long-term average for November. For the month, ice extent was 3.2 standard deviations below the long-term average, a larger departure than observed in September 2012 when the Arctic summer minimum extent hit a record low.
They also do indeed confirm that right now in the middle of winter the sea ice began to retreat …
for a brief period in the middle the month, total extent actually decreased by 50,000 square kilometers, or 19,300 square miles—an almost unprecedented occurrence for November over the period of satellite observations. A less pronounced and brief retreat of 14,000 square kilometers (5,400 square miles) occurred in 2013.
Two Charts

Looking back over the extend of sea ice each and every November, you can clearly see the downward trend.
However, that sudden drop at the end is what has now been happening, and it is that sudden dramatic drop that is leaving everybody truly stunned.
So what about the Antarctic, how are things going there?
It’s the same story, the extent of the sea ice has just dropped off a cliff …
Notice that for November, the sea ice extent in the Antarctic has been slowly increasing each year. That however in no longer the case, it just changed rather dramatically.
2016 is going to be the warmest year ever … globally. These are not abstractions, very real signs and symptoms of this are everywhere.
