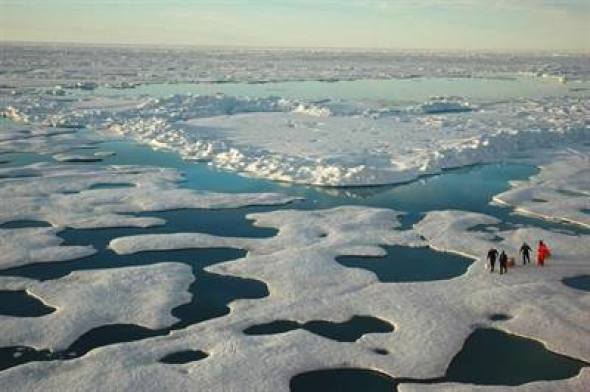
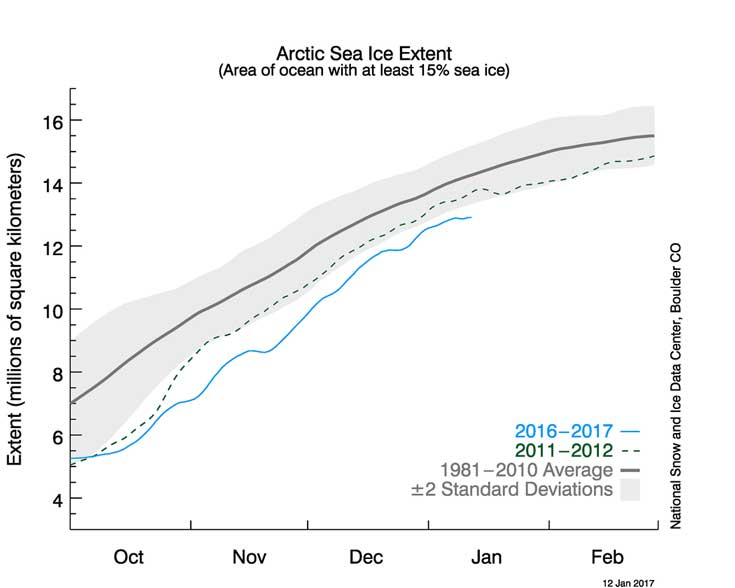
 Some have been claiming that the #Arctic melt was simply a short term blip due to a bit of extraordinary weather, and that the normal patterns are now reasserting themselves. Sadly twitter is full of misinformation.
Let’s take a quick peek at the data and see if this is correct.
 You can check the measured sea ice extent by going to the National Snow and Ice data centre and taking a look to see what the satellite measurements tell us. These are updated every 24 hours and so they enable us to not only see where things stand right now, but to also compare the current trend against every previous year right back to the start of such measurements (1979).
Clearly it is not good news, the ongoing trend continues.
Sea Ice Facts
Sea Ice is perhaps odder than you might think.
Many of us will have perhaps observed a pond freeze over and have seen how the thin surface layer forms and then grows thicker. What is happening there is that as fresh water approaches freezing point, it becomes less dense and rises to the surface. Sea ice is different. Because of all the salt, sea water becomes more dense as it approaches the freezing point and so it tends to sink before it freezes and that makes it far more difficult for sea ice to form. That is not the only factor in play. The freezing temperature of salty water is lower than fresh water. Pure water will freeze at 0 degrees C, but sea water needs to be -1.8 degrees C.
Once it does form on the surface it then has a big influence over time on the weather. White ice reflects sunlight back off the planet, and darker ocean absorbes that energy, so the shrinking of the arctic ice is basically a feedback loop. Less ice on the surface means that the darker ocean will absorb more solar energy and thus warm the ocean which in turn over time leads to even less sea ice. To be a tad more precise …
- ice = roughly about 80% of the sunlight gets reflected
- no ice = roughly about 90% is absorbed
So why study it? Basically because it plays such an important part in climate.
Zack’s tweets tell us the unfolding story
Zack Labe, a PhD student, tweets out some fabulous graphs that truly do tell us the unfolding story …
Current #Arctic sea ice extent remains at a record low for the date (JAXA)… unfortunately, increasing warmth in Atlantic sector next week pic.twitter.com/DdKSSWsjc5
— Zack Labe (@ZLabe) January 13, 2017
Again, no, #Arctic sea ice not recovering. Extent/thickness/volume of ice are all the lowest on record for the date as we start 2017… pic.twitter.com/AGKC2Q8T1V
— Zack Labe (@ZLabe) January 10, 2017
As expected, preliminary surface air temperature reanalysis (NCEP/NCAR) highlights 2016 as the "warmest" on record in the #Arctic pic.twitter.com/zFdyOA4ymO
— Zack Labe (@ZLabe) January 3, 2017
Preliminary monthly temperature rankings (925mb, reanalysis) in the #Arctic (>70°N) over the satellite era through 2016 pic.twitter.com/9ldZ8ZOpCY
— Zack Labe (@ZLabe) January 3, 2017
particularly unfavorable period ahead for sea ice export in addition to another WAA event pic.twitter.com/9wYJtFi0Sm
— Zack Labe (@ZLabe) January 11, 2017
Hey, not fair, others also have something to say. Well yes of course they do …
January #Arctic #seaice extent has been getting consistently lower since 1979. GIF from @dmidk pic.twitter.com/eHEKoL0AfJ
— Polar Portal (@PolarPortal) January 13, 2017
Further Reading
- Scientific American – Feedback loops between record Arctic temperatures and the jet stream may be altering our weather – Jan 5th 2017
