There is a new study that takes a rather interesting look at Moore’s law. However, before we get into that, first let’s cover the basics by laying out what Moore’s law actually is.
What is Moore’s Law?
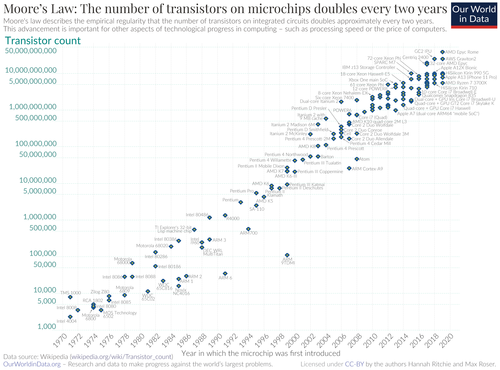
First key point. Moore’s law is not a “law”, but instead is just an observation. It is called “Moore’s Law” because Gordon Moore, the co-founder of Fairchild Semiconductor and Intel, made the observation.
Briefly, back in 1965 he was asked to write a prediction concerning the future of the semiconductor components industry for the 35th anniversary of Electronics magazine. He wrote “”Cramming more components onto integrated circuits” and within that article he made this observation …
…The complexity for minimum component costs has increased at a rate of roughly a factor of two per year. Certainly over the short term this rate can be expected to continue, if not to increase. Over the longer term, the rate of increase is a bit more uncertain, although there is no reason to believe it will not remain nearly constant for at least 10 years. That means by 1975, the number of components per integrated circuit for minimum cost will be 65,000. …
By the time 1975 came about, he revised this by suggesting that the number of transistors in a dense integrated circuit (IC) would double about every two years. Because his prediction has turned out to be right, it became known as “Moore’s Law”.
It is now 2021, so exactly when will Moore’s law hit the upper limits and run out of steam?
What the new paper does is to look back and see what has actually happened. By looking back and observing what actually happened, it then becomes possible to point towards the future limits that are looming and might yet be overcome just as the past barriers to further growth were.
They also create a new model, a better way of analysing it all.
Study: Moore’s Law revisited through Intel chip density
The study is published in the Open Access journal, PLOS and became available on Aug 18, 2021.
What did the researchers do?
They gathered up data for integrated circuits. In this case, because many companies come and go, for consistency, they focused on Fairchild and Intel data. Not only did Gordon Moore make his now famous observation while a director there, but they also form the longest publicly available time series.
Obviously they also picked the highest density product available for each year.
There are also other factors in play. If you simply count the number of transistors per chip as the variable then you have missed something rather important. The size of the chips varies and changes. So how do you solve this problem and come up with a consistent metric?
They calculated the average number of transistors per unit area.
What did they find?
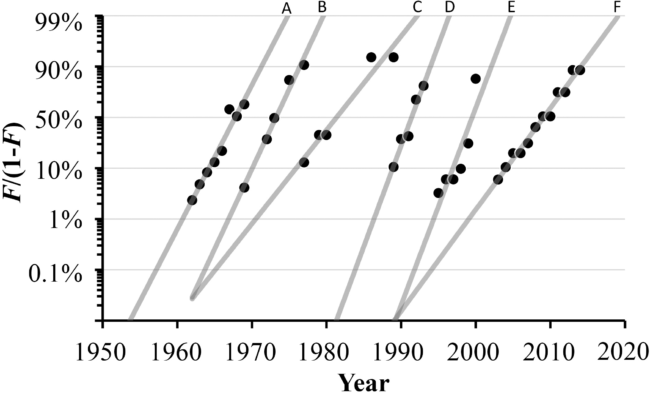
There have been six phases of transistor density increase.
Typically each of these six waves of improvement have lasted roughly 9.5 years. The first six years brought a tenfold increase and then after each is roughly three years of not very much increase.
What is this actually telling us?
The general understanding of Moore’s Law is too simplistic. The idea of an exponential growth does not align with this historical data. A more complex model gives us a far better description of what has actually happened.
The “number of transistors per chip” is a biased descriptor for what has been happening. Chips do vary in size, so it is not a truly meaningful measurement. A better more accurate measurement is transistor density.
Once you measure more reliably, what then becomes visible are the six distinct phases of rapid growth … as illustrated …

These waves ran for periods that ranged from 7 to 11 years.
Why 6 waves with rapid growth and pauses for about 3 years?
This is perhaps driven by business economics. There exists a need to increase revenue from current established products along with the need to compete with newer products and so this pattern emerges from the balance of both of those.
What comes next?
Physics has some rather fundamental laws that will impose limits on what can be done.
The good news here is that such limits are many orders of magnitude beyond what is currently being done, so we have not yet reached that end-game.
Fundamental laws are not the only barrier, we also face more immediate and obvious challenges such as thermal limits and the ever increasing economic effort required to keep going. If each successive generation costs more then there comes a point where it ceases to be viable for a business because the cost will exceed the profit.
The next wave of improvements is due about now. What drives that is the need for even more processing power for AI models. Automated cars may also create a huge demand – 10 cameras and 32 sensors per car means that vast amounts of data has to be crunched in real time.
The paper takes a leap and speculates. They suggest that transistor density evolution may indeed saturate, but only after one or possibly two more pulses.
So what technology actually comes next?
They have a list …
…advances in software optimized for parallel computing allowed by multicore processors are an important avenue of maximizing processing power [86]. Work has been under way for over a decade to realize immersive excimer laser and EUV metrology [87]. New research is under way into nanotransistors [88, 89] and single-atom-transistors [90], while another possibility may be quantum computing [91]. In 2019 Alphabet claimed a breakthrough in quantum computing with a programmable supercomputing processor named “Sycamore” using programmable superconducting qubits to create quantum states on 52 qubits, corresponding to a computational state-space of dimension 253 (approximately 1016) [85]. The published benchmarking example reported that in about 200 seconds Sycamore completed a task that would take a current state-of-the-art supercomputer about 10,000 years. …
Summary
What has actually happened is not a linear curve, but instead is a series accelerations and decelerations.
What the paper describes is a model that is an alternative view to Moore’s Law, and it can be argued is better. (They do make that argument in the paper statistically).
It is not yet end-game. We have seen six waves. From our current vantage there appears to be enough steam left in this for one or two more waves. That last bit is not rock solid, just speculation based on what we know right now.
That translates to roughly another 7-22 years of Moore’s law.
It will be truly fascinating to see how this plays out.
