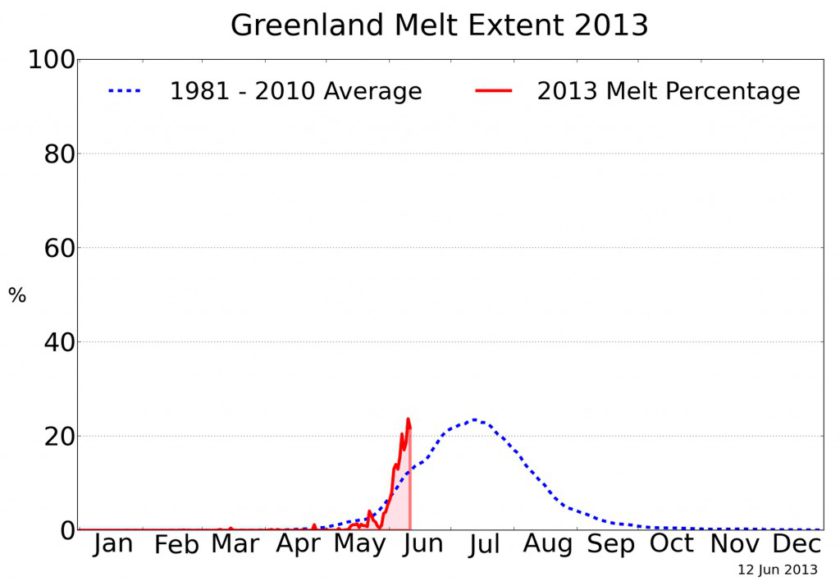
Last year we saw an almost unprecedented melt of both Arctic sea ice and also in Greenland, and so far this year we are on track for the same once again. In fact it looks like the melt will be even greater this year:

The graph above comes from the National Snow and Ice Data Center’s web page on the state of the Greenland Ice Sheet:
- The red line shows the percentage of the ice sheet experiencing melting this year, month by month; the blue line shows the 1981 to 2010 average.
Ah but what about what is happening now, how does that compare with what happened last year? Well, here is what happened last yearl …
Ted Scambos, lead scientist for the National Snow and Ice Data Center research team, comments
“The current pattern is generally similar to last year’s record-year pattern. So [a repeat] is plausible. Moreover, in the last week or so, conditions have been quite warm in Greenland relative to the norm.”
The Arctic Weather
Temperatures in Greenland have been higher than average this winter, with air temperatures near the coast averaging 2.0 to 3.5 degrees Celsius (4 to 6 degrees Fahrenheit) warmer than the 1981 to 2010 average. This has in part been a result of the persistent circulation pattern for the Arctic this winter, characterized by a negative Arctic Oscillation (AO). The AO is a measure of the intensity of the general pattern of low pressure over the northern high latitudes. A negative AO indicates higher-than-average pressures near the North Pole, allowing more frequent southward cold air outbreaks, and more intrusions of warm air masses from higher temperature areas.
Links
- The NSIDC Greendland page is here … they update it each day with the latest satellite data and so you can see what is happening in real time.
- PROMICE – The Programme for Monitoring of the Greenland Ice Sheet