

On Aug 29, the non profit Public Religion Research Institute (PRRI) released their data report for 2023. The title above is a spoiler for what is coming up.
The full report is titled “The American Religious Landscape in 2023“
The key takeaway concerns the on-going rise of Unaffiliated Americans.
First the Basics
Before accepting any polling data, you should always pause and consider if it is valid and robust. Is the source reliable, and even if they do have a good reputation, what exactly did they do?
Silly example: Coming to a conclusion regarding religious demographics on a national scale by polling a dozen people as they leave church on a Sunday might indeed yield an answer, but for rather obvious reasons it is not going to be accurate.
So what should you do?
Ask yourself two quick scratch and sniff questions to determine if there is any hint of a dubious aroma :
- How robust is their reputation?
- How was the study being presented done?
PRRI have been going for roughly 15 years. They specialise in the quantitative and qualitative study of political issues as they relate to religious values.
But are they reputable?
Yes they really are. In fact that is so much so, to quote Wikipedia (which has the references) …
Studies and data produced by the PRRI have been used in a variety of peer-reviewed scholarly analyses of religion and American culture, including studies on economic inequality and questions of redistribution,[2] attitudes toward immigration,[3] attitudes toward climate change,[4] and religious attitudes toward social prejudice.[5]
But what about this specific study?
Always always always … (did I by any chance happen to mention “always”) … look for full transparency. If the methodology is not available then doubt and skepticism is your best play.
In this case they have a comprehensive methodology section at the end. There they explain that they polled 40,000 randomly selected people scattered across all 50 states for this 2023 report. They also explain who sponsored them for this, how they randomly sampled, what their data source was for randomly selecting people, what their statistical margin of error is, the precise numbers for each state, and more.
Bottom Line: This is a meaningful measurement.
OK, let’s get into the specifics.
When asked, what do people identify as?
It breaks down like this …

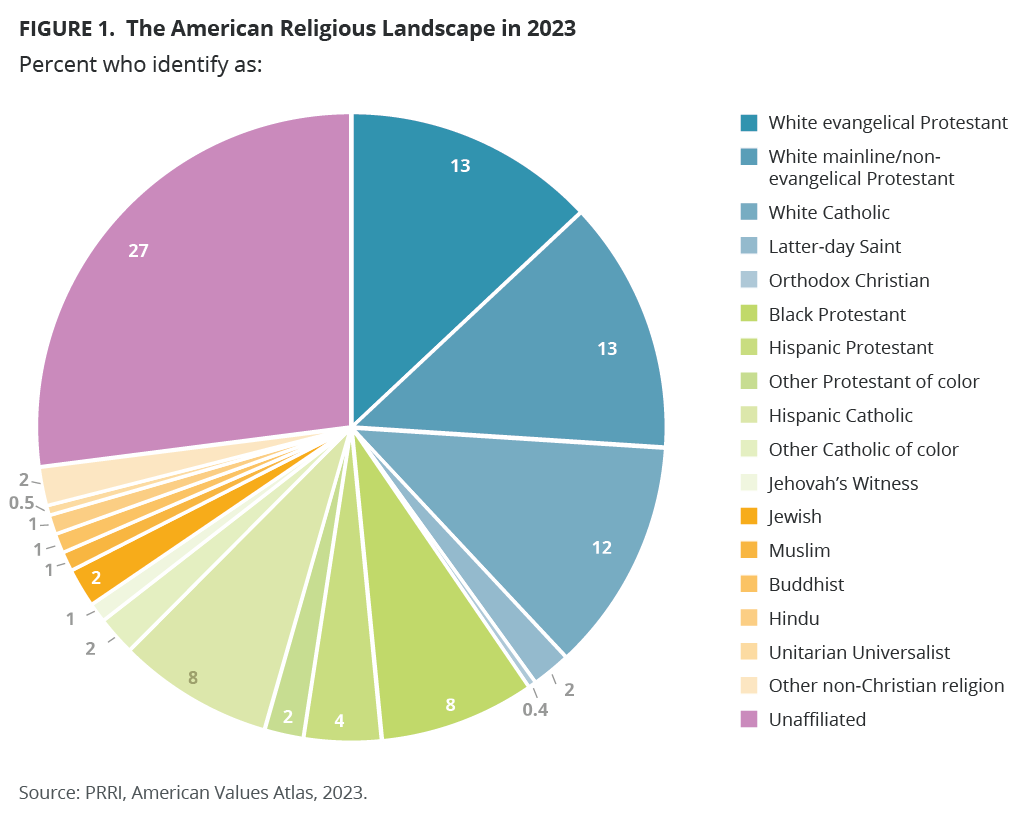
66% identify as some flavour of Christian.
6% identify as some other non-christian belief system … for example Jewish, Muslim, or Hindu.
However, note the purple above … 27% don’t identify with any religion at all.
Surprise: There are far more non-religious people then there are white evangelicals. Combine the white evangelicals with other white mainline protestants … and there are still more non-religious.
While it is of course true that there are more religious than non-religious people, the fascinating twist is that when you get into the numbers game debates then you will discover that you are dealing with Schrodinger’s Christians.
- When counting heads to beef up numbers they are all “Christians”, but also when considering who is really “Christian”, then suddenly those that were previously counted as Christian are no longer deemed to be true Christians and are instead heretics.
Ask an evangelical if Catholics are real Christians and you know the answer. Reverse that, yep, same answer goes the other way as well. Rinse and repeat across lots of different denominations.
So in essence we have large numbers who are recognised as Christian when large numbers are needed, but also at the exact same time, are recognised as not really Christian when you get into specifics. It truly is quirky that people are in a superposition of being both Christian and also non-Christian until you open the box to look – hence Schrodinger’s Christians.
The survey itself is of course just a measurement of how people themselves identify and makes no judgement. That’s as it should be for such surveys.
There is also a bit of caution to toss in here.
If I identify as Catholic, then does that mean I am religious?
Perhaps or perhaps not. The point is this. Some do use religious identities but don’t actually practise the belief.
Just to drive that point home, there really are people who identify an evangelical but are not religious at all – Republican Atheist Evangelicals.
There is a fascinating article by Ryan Burge on that …
- The Rise of the Non-Christian Evangelical (sorry paywall on this one)

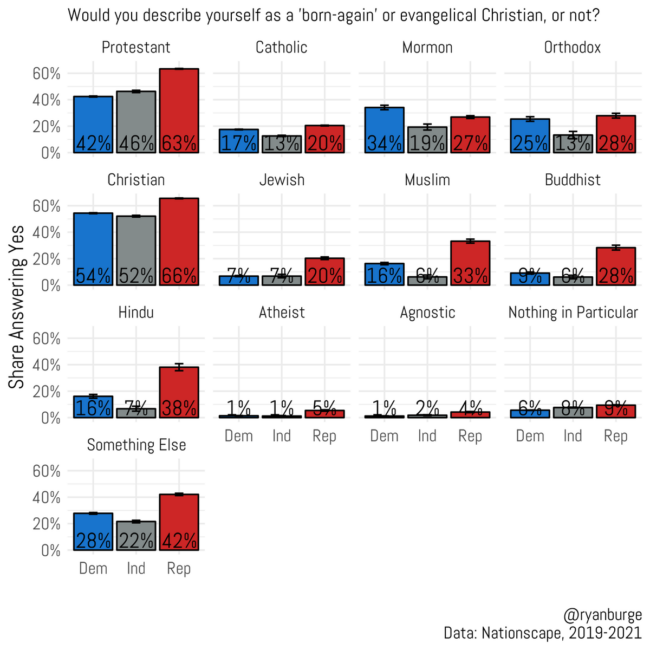
… yes, it’s weird … but hey, what can I say except welcome to 2024, an age where the terms such as “evangelical” and also “born again” have taken on a political meaning that replaces the religious understanding of them.
OK, let’s move on and look at how trends have been changing over time.
How have things changed over the years?
The trends are like this …

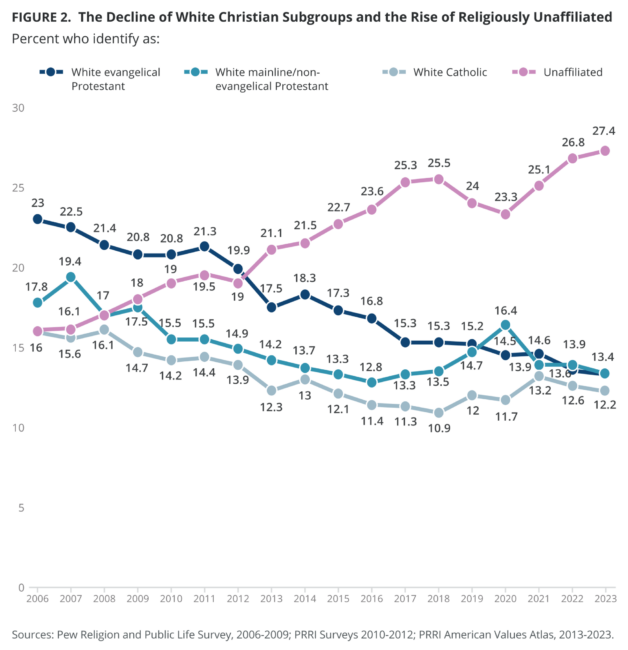
In essence 2023 is simply one more data point that reveals that the numbers of non-religious people continue to increase as Christianity continues to decline.
But wait, there is some interesting nuance here.
You might also wonder why PRRI have specific lines for just white.
This is because roughly about 25% of Americans identify as Christian of color and that percentage has remained consistent over the past decade. What PRRI are drawing out here is that the rise of the Nones, has seen a corresponding decline of white Christianity.
As a side note, the share of non-Christian religious groups has remained at a steady 6%.
How does this manifest across different Age Groups
Like this …

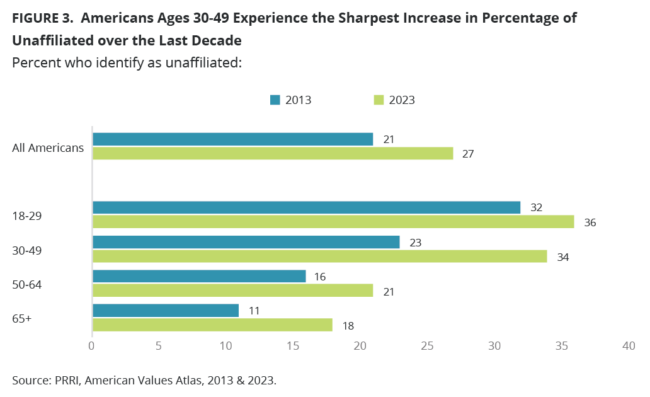
Yes the 30-49 age group has seen the largest increase, but the increase applied to all.
PRRI also go on to slice and dice things in many different ways. For example …
- The diversity for different age ranges (the younger you are the more diverse things get)
- The average age within different groups (white evangelicals are on average 53)
- Which groups are most likely to have collage education (Hindu and Jewish)
- Which groups are the least educated (Jehovah’s Witnesses)
- How do things slice up by … race, political allegiance, etc…
One rather unique thing that PRRI does is to drill down to county level. The details for this is what most of the rather large report contains.
If curious about your county, then dive in.
OK, there is one other thing I’d like to cover off.
What does “Unaffiliated” mean?
They do define it by breaking down that 27% as follows
- 5% Atheist
- 5% Agnostic
- 17% Nothing in Particular
To be clear, these need not be mutually exclusive terms, it is what people opted for when asked.
For example, you can be all three … I do not believe (Atheist) and at the same time, I do not know (Agnostic), and again in parallel, you might also opt for not really being interested in any specific labels at all (Nothing in Particular).
It also does not preclude people from being Spiritual and so their stance is one in which they opt out of organized religion. This means that they might be Deist, or something else, or even that they really do opt for Naturalism and reject all forms of Supernaturalism due to the lack of any empirical evidence.
My point is this – It’s complicated, fuzzy, and fascinating.
You can also encounter people who are openly Atheist and yet they also attend religious services on a weekly basis. That can happen for not just the obvious reasons, such as going along with a partner or a parent in order to spend together time with them, but can also happen because people who once believed find they no longer do, but keep going because they like the social circle of friends and nobody is too bothered that they are not as deeply religious as they used to be (not all churches are some like, but some are). As I said, it’s complicated, and so measuring stuff like this can be tricky … sort of like trying to nail jello to the wall perhaps.
Key Point: being a “none” and unaffiliated is still an increasing on-going trend.
An earlier downward blip recorded by Pew in Jan prompted them to ask if the rise of nones had reached the top. Their conclusion was that one data point is not enough, you need to see what happens over the longer term.
Step back and look at the overall trend reported by PRRI, and you can see that while there have been pauses and the occasional downward drift, it then resumes and proceeds to increase every further.
The grip that religion once had is gone, and the ongoing trend suggests that this dramatic shift is ongoing and will continue.
One Last Question
This is the very obvious one – what is going on, what has this been happening?
There is the part where I normally leap in with my own thoughts on this. However, not this time. Instead I’d like to lean upon the wisdom of crowds by asking you for your thoughts on it.
Why has there been an ongoing rise of Nones over the past few decades, what is driving this?
Feel free to chip in within the comments.